Methods and Introduction
To understand the relationship between different languages given their respective sound information, we need to visualize them to gain insight as to where the languages lie relative to one another. The visualization of the sound space of over 100 sounds (variables) is not straightforward as the maximum number of variable we can plot on a graph is three. In order to reduce the dimensionality of the dataset down to a visualizable number, we have chosen to cluster the sounds into three groups.
This analysis is done on two sets of languages: Uto-Aztecan and Bantu. For Uto-Aztecan, we have 141 sounds for 40 languages. For Bantu, we have 287 sounds for 105 languages.
k-Means clustering is our method of choice. This will cluster variables into a set number of groups solely based on their mathematical distance from each other. In this case, we need to reduce the number of variables to plot from 100+ down to 3. So, we set k = 3 and have the algorithm select 3 distinct clusters of sounds.
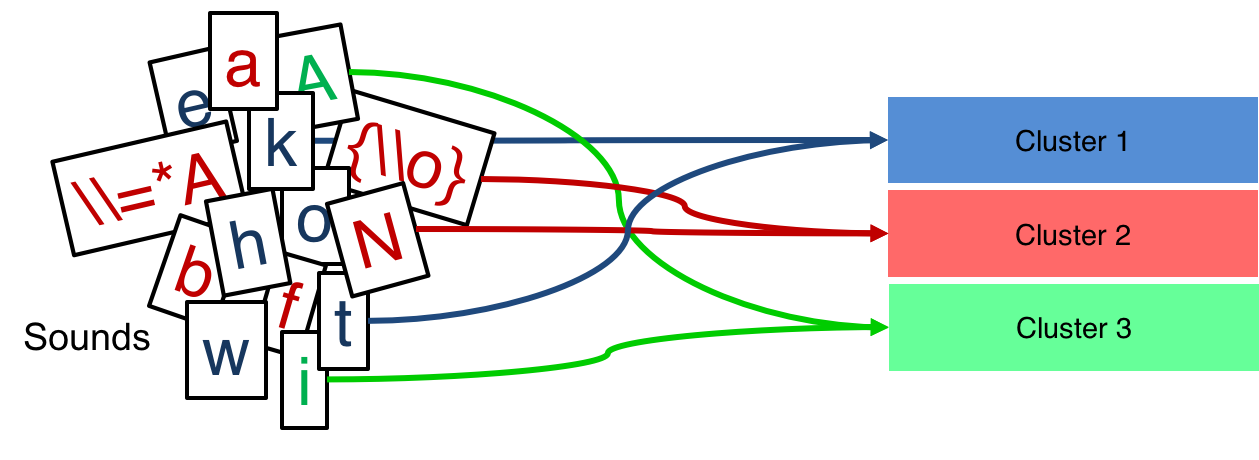
In general, the k-Means clustering algorithm will treat rows as individual cases and columns as the variables to measure (determine their distances from). This would mean that the analysis groups rows together based on the distances it found in the variables (columns). However, we need to group sounds, not languages. So, the data set needed to be transposed to switch rows and columns. (See tab: Language Data Format) Once the data is transposed, it is then passed to the k-Means algorithm, which is initialized using a random seed and set to run using 10,000 iterations to assure convergence. In other words, begin with a random set of variables and run through lots of iterations to make sure it completes the analysis with all available data.
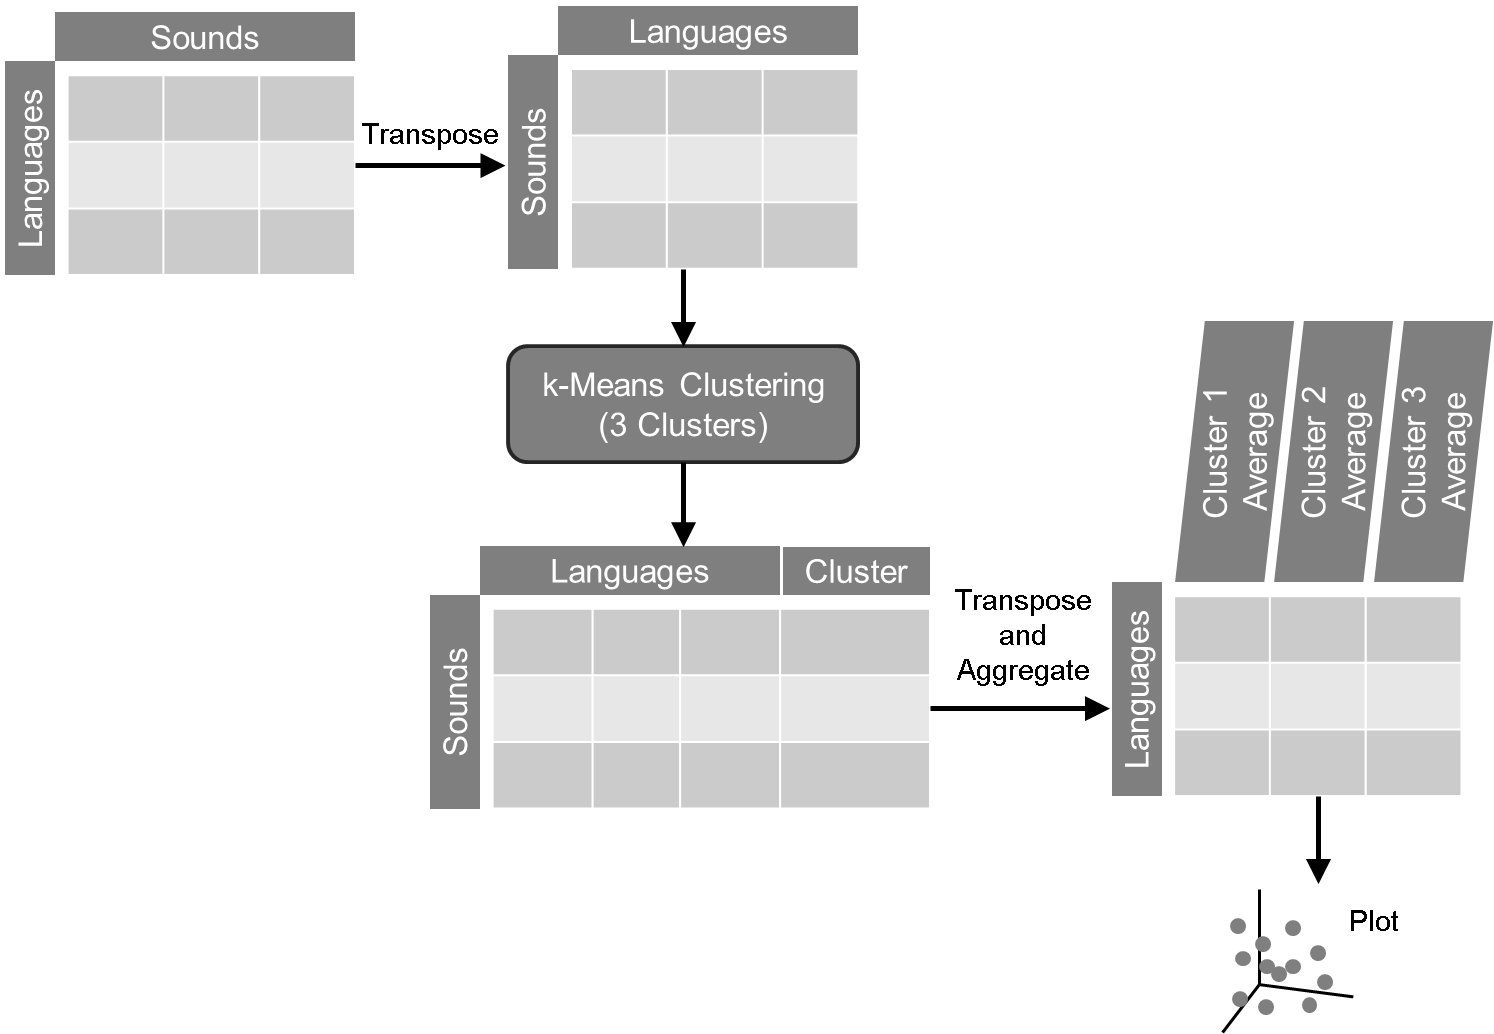
The algorithm creates a new column with the cluster assignment for each sound. (See tab: Sound Cluster Assignments) This information is now pivoted to get the average values for each cluster of sounds per language. Then, this information is plotted in a 3-dimensional space with each of the clusters as an axis.